Nobody cares about skills. It may sound controversial, but it is the reality for most business leaders and talent executives.
A common research finding is that skills is a top issue for CEOs, learning and development experts, hiring and talent executives, and employees.
But skills in and of themselves don’t have value for these stakeholders. More is not better and not all skills are valuable. Skills have value only to the extent that they contribute to a business and the people in the business.
For example, C-suite executives care a great deal about business agility, improved customer service, and better products and services. And skills can be an engine to achieve these goals or a formidable barrier to success.
On the people side, team members want fulfilling work, rewarding careers, and personal development. These are also related to skills, but skills with intent and purpose.
Successful organizations connect skills strategy to a value story that resonates with business leaders and employees.
An essential part of this strategy is building the right partnerships and communicating with influential stakeholders. This helps create buy-in and generate the momentum and support needed for any skills initiative.
One way to communicate skills strategy and performance is through the use of skills dashboards. This topic formed the crux of our latest skills roundtable session and our cross-industry working group took a deep dive into it.
Let’s start from the basics.
What is a Skills Dashboard?
A skills dashboard is a visual representation of skill data. It may show individual skills profiles, team-level data, or provide organization-level trends and insights.
It assists employees, team leaders and business executives in answering critical questions about their current skill levels, where they want to be, areas for improvement, and opportunities for skill development.
As more organizations move towards creating a skills-based workplace, skills dashboards are also finding increasing importance in identifying skills gaps and tracking progress.
Some other benefits of skills dashboards include:
- Aligning Skills with Organizational Needs: By identifying the current skills and capabilities of the workforce, an organization can set specific goals that align with business needs. It can also make plans to maximize available human resources through reskilling, upskilling, mobility, and other rightskilling strategies.
- Identifying Skills Gaps: Dashboards show skills gaps for individuals and teams. Team members and people leaders can take advantage of this insight to drive training and development efforts.
- Facilitating Career Development: Employee engagement, talent mobility, and career success are some people-focused goals organizations seek to achieve with skills. A skills dashboard can help facilitate these by showing skills adjacencies and identifying opportunities for growth, development, and mobility.
- Communicating Goals and Performance: Most dashboards are in a visual form which makes them the perfect tool for showing business leaders the impact and next steps for a skills initiative.
What are the Components of a Skills Dashboard?
With a solid grounding in the types of skills dashboards and their purpose and benefits, our executive group considered two related questions.
- What does a skills dashboard look like and what area(s) should be included in the dashboard?
- How do we show clear/tangible business impact by focusing on skills?
Kashif, the Total Reward Transformation Leader at MetLife explained that, at MetLife, they are exploring meaningful ways to provide information to business leaders to help their decision-making, especially on scaling.
“Understanding what others have done in this regard and what KPIs or information business leaders found helpful will be insightful.”
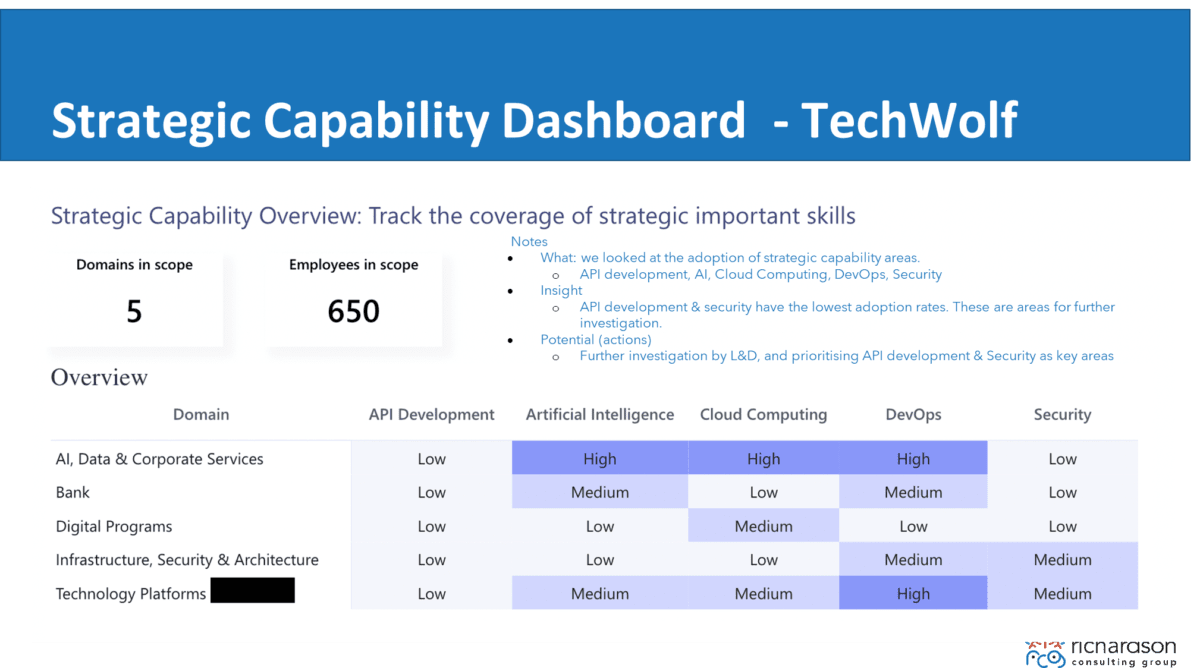
Here is an example of a strategic capability skills dashboard from TechWolf. The main components of this dashboards are:
- Priority Skill Domains: What are the critical skill domains that the organization cares about and is focused on improving?
- Current Level of Employee Skills Proficiency: What are the present employee skill levels in these domains?
- Skills Expectations and Gaps: What are the business expectations in terms of skills level and what are the gaps?
- Skills Action: What are the next actions to better understand and close these gaps?
Mikael, the co-founder and COO of TechWolf, gave some further explanation. For him, dashboard design needs to start with what is the relevant information to show, especially to business leaders, and what actions or decisions are to be made based on this information?
This example dashboard shows critical capability areas and skills clusters, as well as clear, succinct guidance on actions and decisions. This supports turning focused insights into focused action.
Jan-Willem, Managing Partner at Digital Skilled Professionals, shared a similar opinion on dashboards.
“When I think about dashboard design, it’s very similar to a slide. One slide should have one message. And it’s the same with high-level dashboards, especially when talking about skills, and when showing skills data to HR and other leaders”
With dashboards, less is more. It makes dashboards clear and communication efficient.
While it may be true that nobody cares about skills by themselves, everybody needs to have the right insights into skills to make decisions and to take action.
To provide these insights, design skill dashboards that are simple, answer relevant questions in a succinct way, and provide clear guidance on next actions to take.
How to Communicate Performance to Business Leaders Using Skills Dashboards
One of the key use cases for skills dashboards is to communicate talent strategies and workforce plans with business leaders.
Business leaders don’t have the time or desire to go through detailed skill reports or dig into complex data. You can help them make informed decisions and develop better skills strategies by presenting data in a crisp, visual format.
But how do you do this? Kashif gave some further clarity by highlighting that skills require some investments such as skill platforms, tools, or other resources.
“So, it’s a question of what’s in it for me? Why do business leaders have to invest in these resources when there are other ongoing business priorities? How is this going to help us do things better and what is the business impact?”
For Marcello, the Global Learning Leader at AbbVie, there is a big challenge when working with a business with a focus on skills versus a focus on performance improvement.
This is because performance gaps are usually well-defined and can be covered with specific solutions from a training perspective.
It is not the same when focusing on skills. It is trickier to define the specific business needs unlike in performance interventions.
Nevertheless, skills should lead to observed and measurable behavioral changes. These changes can be reported to business leaders.
For example, you can demonstrate that behaviors A and B are prevalent before any skills intervention. Now the team has acquired new skills and they are behaving in a different way, which is the way we expect them to behave.
Mikael from TechWolf demonstrated how to engage business leaders by sharing a talent mobility dashboard example.
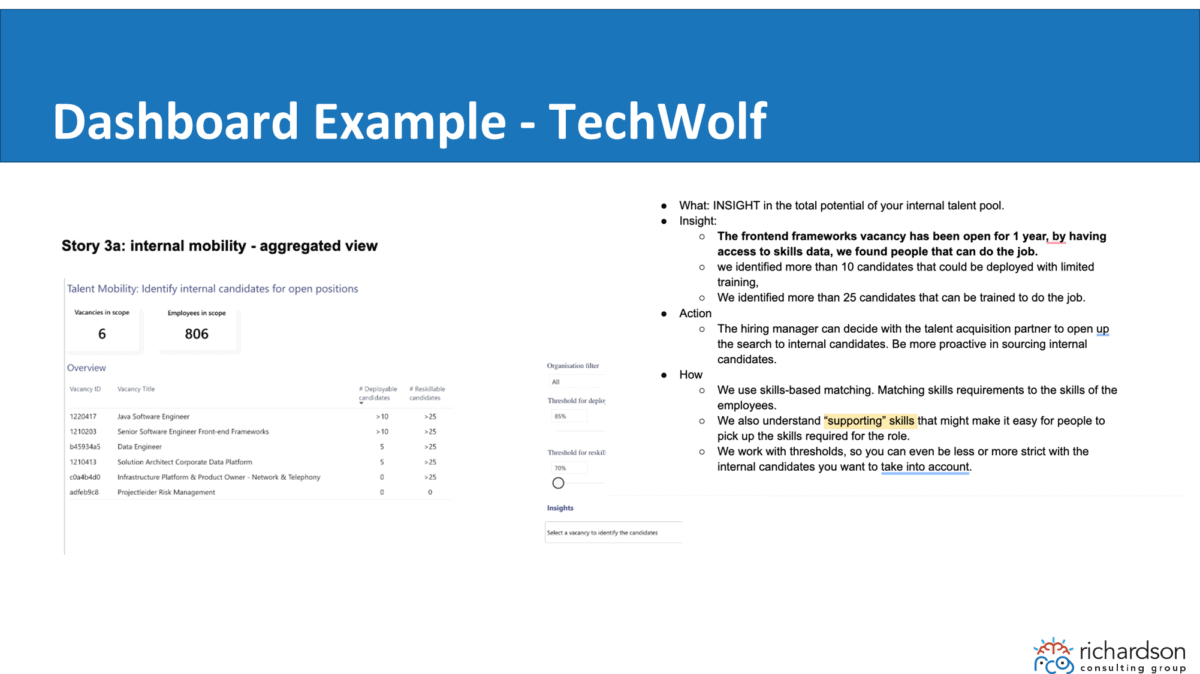
The dashboard is for an organization of about 5,000 people. It provides options for business leaders to address a long-standing vacancy in an important role.
There are more than 10 people that can be deployed right away while more than 25 people can be reskilled based on available data.
“The dashboard answers a simple question, do we want to look internally for talent? Do we want to source internally for a vacancy we weren’t able to fill?”
Some Other Samples of Skills Dashboard
Here are more samples of skills dashboards, courtesy of Jennifer Gropel from Degreed.
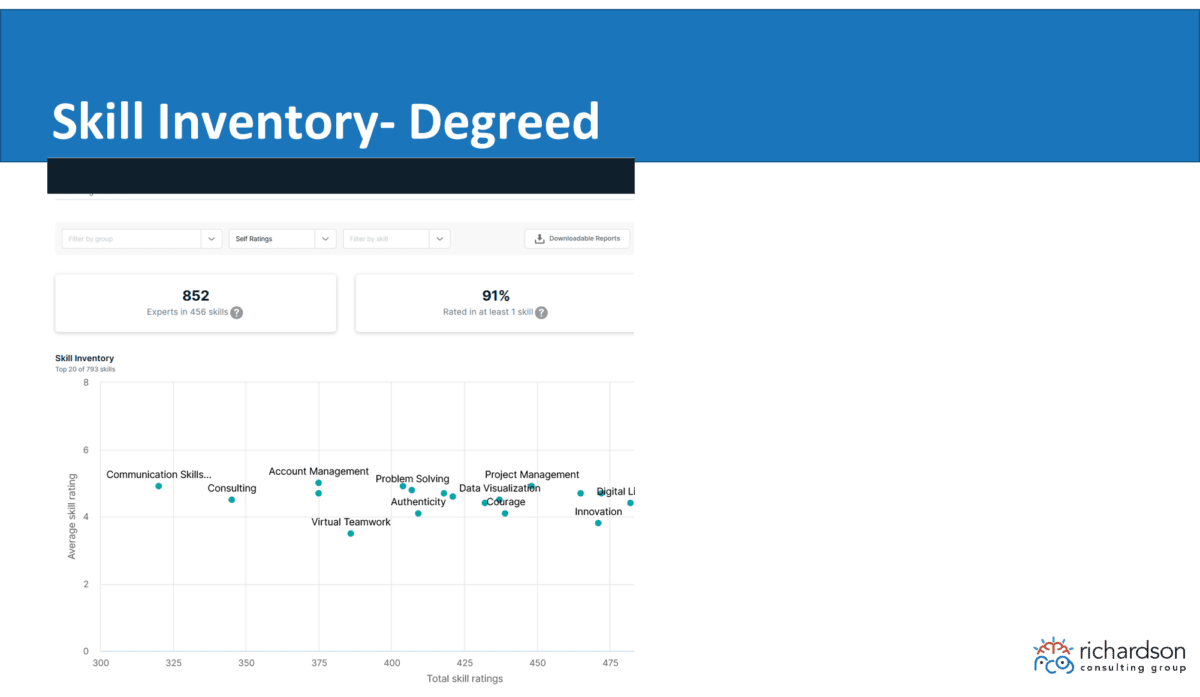
The example above presents a simple inventory view of skills in the organization.
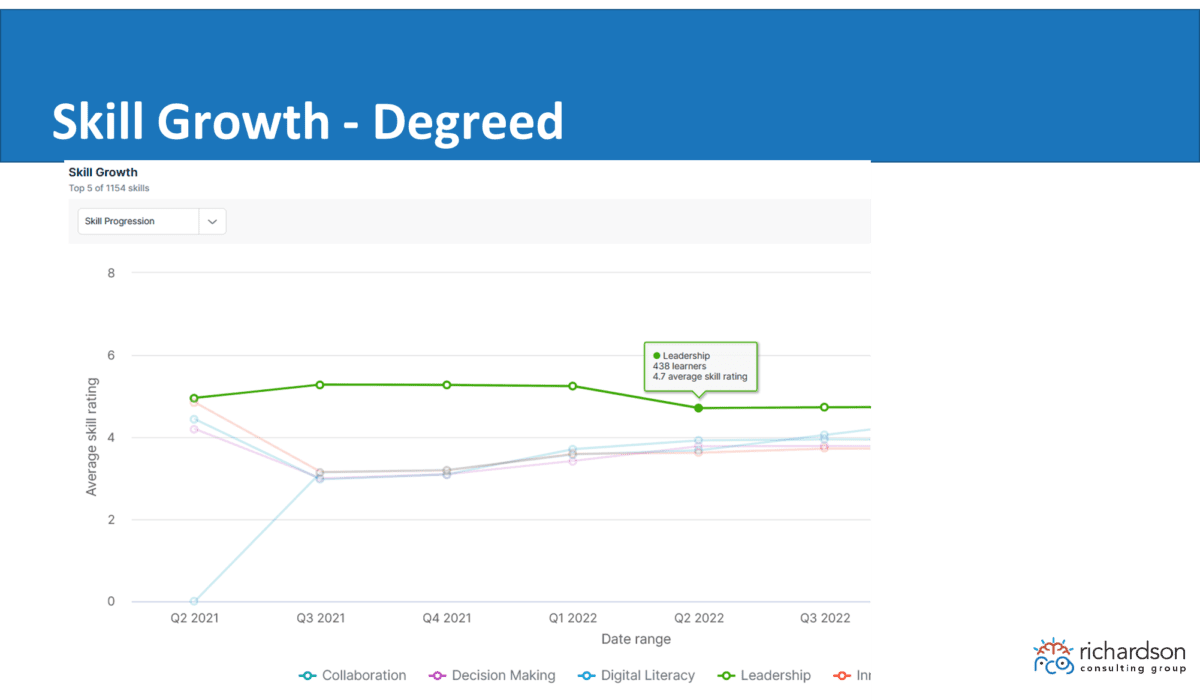
The graph shows the skills and skills level across the organization as well as skills growth over time for collaboration, decision-making, digital literacy, and leadership skills.
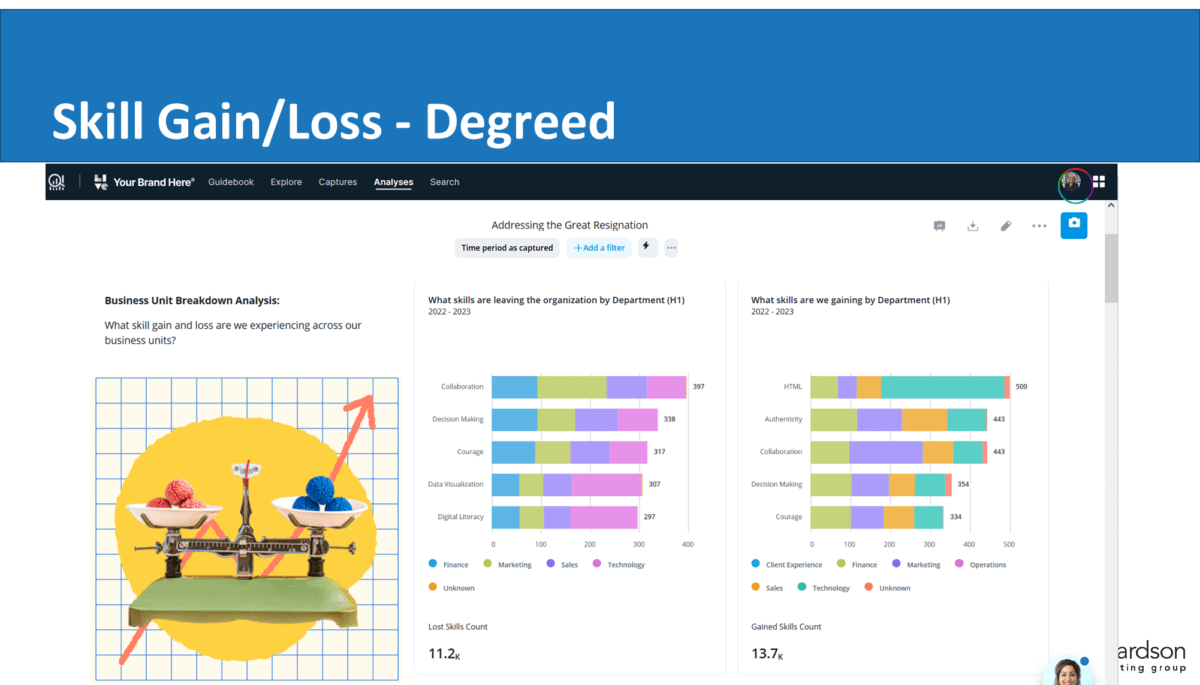
This example shows skill gain and skill loss across business units for a specified timeframe. This type of dashboard is particularly useful for tracking progress towards specific goals, and showing areas where the organization needs to improve.
Focus on Key Metrics and Actionable Insights
Skills dashboards are a powerful tool for tracking and improving skills development at the individual, departmental, and organizational levels.
By providing clear insights to important skills questions, they can help individuals, team leaders, and organizations identify areas for improvement, set goals, and track progress towards achieving these goals.
To be effective, skills dashboards should be easy to use, easy to understand, focused on critical questions, visually appealing, and provide actionable insights and guidance on next steps.
Establish a regular cadence of generating and communicating dashboard information for all key stakeholders as a way to keep them engaged in your skilling efforts, and informed of the impact of skills in the business, and for the people in the business.
If you have further questions on skills dashboards or broader questions about skills strategy, culture, architecture, data, and analytics, you can book a one-on-one session with me. You can also join our team of experts at an upcoming roundtable session.