
Storytelling is as old as humanity. Before we had art, before we had writing, before we even had language, we had stories.
Imagine a prehistoric hunter – Harry the Happy Hunter – coming back to his village with a giant tiger he caught and killed.

Harry’s returned with enough meat to feed several families for a few days. Flush with excitement, he uses vocalizations – remember Harry doesn’t have language yet – and wild hand gestures to tell the tale of how he spotted the tiger in the woods, tracked it for hours, waited until just the right moment, then took him down with his ax.


Imagine the whole village gathered round in rapt attention, as he tells the tale. And imagine dinner tasting that much better knowing that story.

Our brains are wired for stories: to hear them, to watch them, to read them. Which is why storytelling is so important and so effective.
Stories are:
Engaging – The moment a story starts, our brain starts firing. We become engaged in the scene, the characters, the challenges they face, their triumph over adversity. We are wired to do this.
Memorable – Stories help us store information in our brains. If you read this list of words with no context: Harry, happy, hunter, village, tiger, hatchet, dinner and tried to remember them, you would be lucky to remember half of them by the end of this article. But if you remember Harry’s story, you’d get most if not all of them right. Stories give a structure to information that improves memory dramatically.
Persuasive – Stories are persuasive because they engage our emotional brain. And our emotional brain controls most of our decisions. “Wait a minute!” you might be thinking, “I make my decisions based on logic and reason!”. This is a common belief, but neuroscience says that we make decisions based on intuition, and then justify those decisions with data and facts.
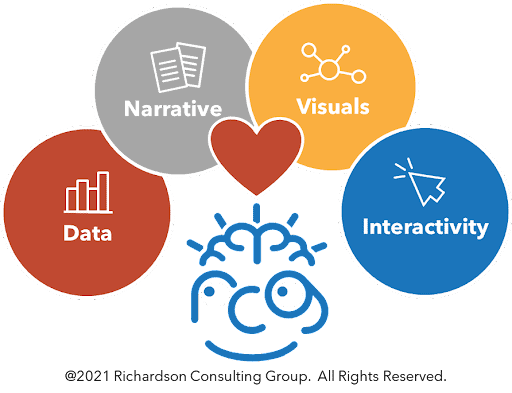
Which brings us to stories with data. Data and data visualization can play an important role in storytelling in a couple of ways:

Attention. Numbers and charts grab our attention. We are drawn to pictures that give us information about trends, relationships or insights.
Credibility – Data that supports your analysis, conclusions and recommendations gives people confidence that reinforces their emotional response and intuition.. If you have good data, and a good story about the data, it is a powerful combination.
Motivation – Data helps us create a sense of urgency to take action. We can use data to show how big a problem is, or how important an opportunity is, and why the time to act is now. And if we can convey this in the form of a story, it is that much more compelling.
So how do we create stories with data?
Here is a 5-step process:
1) Understand Your Audience. What are their goals and expectations? Are they looking to be educated or informed? Are they expecting to make a decision or take some action? How much do they already know about your topic and your data? Do they have enough background and expertise to draw some conclusions on their own, or will they need some context and explanation to understand what the data is and how to interpret it?
2) Understand Your Data. To tell a data story, we need to understand our data. And one story we can tell is our journey to understand our data. As you explore your data, keep notes on what you find interesting, on what you learn along the way, what you get right and what you get wrong.
3) Create Your Narrative. A simple narrative should have a beginning, middle and end. One classic pattern is a main character who encounters adversity, struggles at first and eventually succeeds. Through the struggle, the character learns or changes in an important way that helps him or her find success.
For example, the story could be that, as you look at your data, your initial ideas about what it was telling you turn out to be wrong. You have to dig deeper, form a different hypothesis, and try a different analysis. As you go through this process, you learn something, find a key insight, and develop recommendations for what to do about the results.
Bringing your audience with you in that story is a great way to grab and hold their attention. They will empathize and relate to you struggling a bit, and they’ll be curious to know what happens next. They’ll root for you to solve the problem. And when they do that, they’ll be more invested in the conclusions and more likely to take action, because your recommendations will become their recommendations.
Often we present our recommendations first, then use our data to explain or justify what we are recommending. There is a time and place for that kind of presentation, but if one of your goals is to persuade or motivate, don’t miss out on an opportunity to bring your audience along the journey with you and tell the story of how you reached the conclusions and recommendations you did.
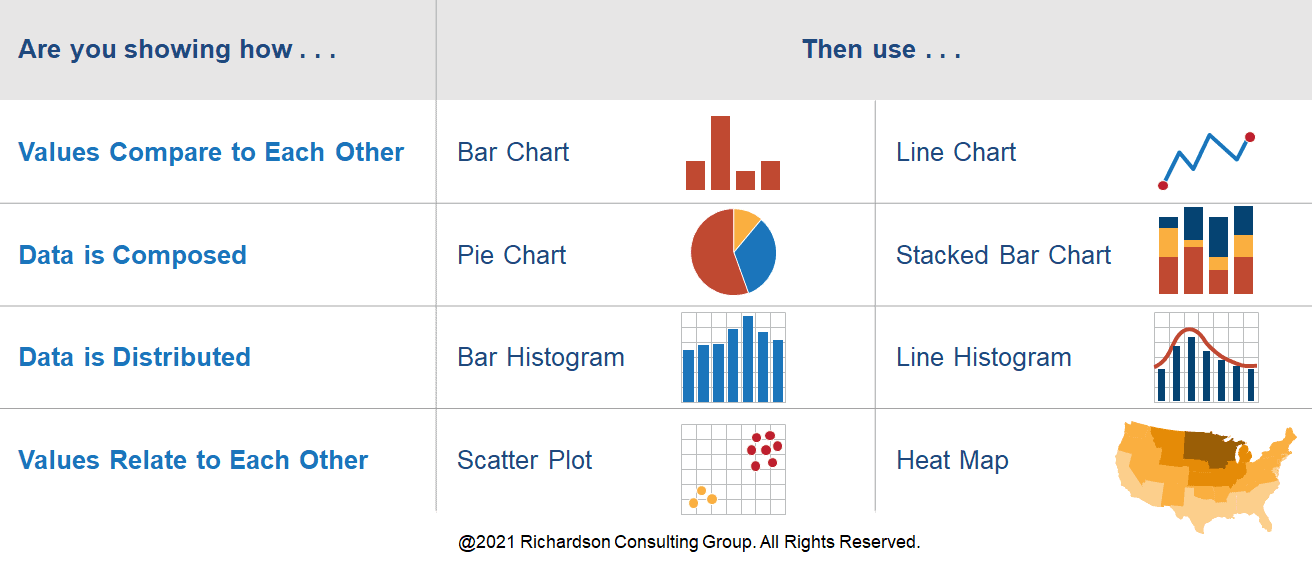
4) Create Your Visuals. Think about what data you want to show, and what’s most important. Less is more. Your audience doesn’t need you to show all of your work, they need to see where to focus. Some of the more common things you’ll want to show with your data are:
a. How values compare to each other. For example last year’s results compared to this year’s results.
b. How data is composed. For example proportions or percentages between different categories – like how the results break down by senior leaders vs. managers vs. staff.
c. How data is distributed. For example how data changes over time or where data is concentrated.
d. How values relate to each other. For example how one set of values correlates to or impacts another set of values.
Here is a quick reference for some of the most common visualizations:
For more options, many more visualization types are described in the The Data Visualisation Catalogue. For more examples and inspiration, try Information is Beautiful.
5) Structure Your Interactions. In addition to engaging your audience in a story, you can engage them through interactions. Soliciting feedback, asking questions, live polling, a quick brainstorming exercise are some of the techniques you can use to engage your audience. You might show them a visualization showing a trend, then ask them to guess the root cause. Or poll them on what the next step should be. By involving your audience in working through the data and conclusions, they’ll be more engaged in the story, and more invested in the outcome.
Using this process, you can tell stories with data that are engaging, memorable and persuasive, and help your audience turn data into insight and action.